EN
EN

A Complete Journey of One Tonne of Steam
A notable industry benchmark: at a textile mill, a steam flash recovery system converts high-pressure steam into low-pressure steam for direct use in dyeing machines. This system recovers approximately 250 tonnes of low-pressure steam per day, saving roughly 4,500 tonnes of standard coal annually. Combined with steam cascade utilization and waste heat recovery, the plant achieves total annual savings of approximately 16,000 tonnes of standard coal equivalent and a reduction of 40,000 tonnes of CO₂ emissions. The key takeaway is not that fuel is too expensive — it is that steam is not being fully utilized.
Many plant managers can calculate the cost per tonne of steam, annual consumption, and its share of total operating costs. But when asked “Where exactly is your steam being used? Is there any waste? Can it be recovered?” — a systematic answer is often missing. Without this visibility, energy efficiency projects and fuel-switching decisions lack a reliable data foundation.
This article traces the actual flow path of one tonne of steam through an industrial facility, from generation to end use.
1. How One Tonne of Steam Is Generated
Steam is a heat-carrying medium. For saturated steam at 0.8 MPa (a common industrial pressure), the total enthalpy per tonne is approximately 660,000 kcal. Of this, the latent heat of vaporization — the portion that actually performs work in heating processes — accounts for roughly 485,000 kcal. The remaining sensible heat resides in the high-temperature condensate. If condensate is not recovered, this sensible heat is discharged directly to the environment.
To put this in fuel terms using natural gas: with a lower heating value (LHV) of approximately 8,200 kcal/m³, boiler thermal efficiency of 94%, and 20 °C makeup water (sensible heat ≈ 20,000 kcal), the net heat required per tonne of steam is approximately 640,000 kcal, corresponding to roughly 83 m³ of natural gas. If the plant recovers condensate at 80–100 °C, the feedwater enthalpy rises to 80,000–100,000 kcal, and gas consumption drops significantly.
The steam distribution chain: Boiler → Piping Network → Steam Header → Steam-Using Equipment. Each stage involves losses — and each offers optimization potential:
Stage |
Function |
Key Concerns |
Boiler |
Fuel combustion → water to steam |
Thermal efficiency directly determines fuel cost |
Piping |
Steam transport |
Damaged or missing insulation; excessive distance causing pressure drop and heat loss |
Header |
Distribution to departments |
Unbalanced distribution causes low terminal pressure; severe cases lead to water hammer; wet steam reduces heat transfer efficiency |
End Use |
Steam releases heat to process |
Heat exchange efficiency; whether condensate is recovered |
Saturated vs. superheated steam: Industrial boilers typically produce saturated steam for heat exchange and process heating. Superheated steam is primarily used for power generation and long-distance transmission (to avoid condensation and water hammer). Short-distance plant piping generally uses saturated steam.
2. The Five Paths Steam Takes in a Factory
Once steam enters the plant, it follows one of five general routes:
Application |
Method |
Typical Scenarios |
Power drive |
Drives turbines or pumps |
Cogeneration, large pumps/fans, vacuum ejectors |
Process heating |
Reactors or heat exchangers heat materials to target temperature |
Chemical reactions, oil refining |
Material drying |
Dryer cylinders or kilns remove moisture |
Paper, fiber, board |
Sterilization |
High-temperature steam kills microorganisms |
Food, beverage, pharmaceutical |
Space heating |
Winter workshop or plant heating |
Northern climate factories |
Each application demands different steam parameters — some require high pressure, some need continuous supply, others are seasonal. Steam safety valves play a critical protection role in this chain. Boiler drums and superheater outlets must be equipped with safety valves that open automatically when system pressure exceeds the set point and close when pressure recovers. Full-lift spring-loaded safety valves are the standard selection for steam boilers, with lift height not less than one-quarter of the orifice diameter.
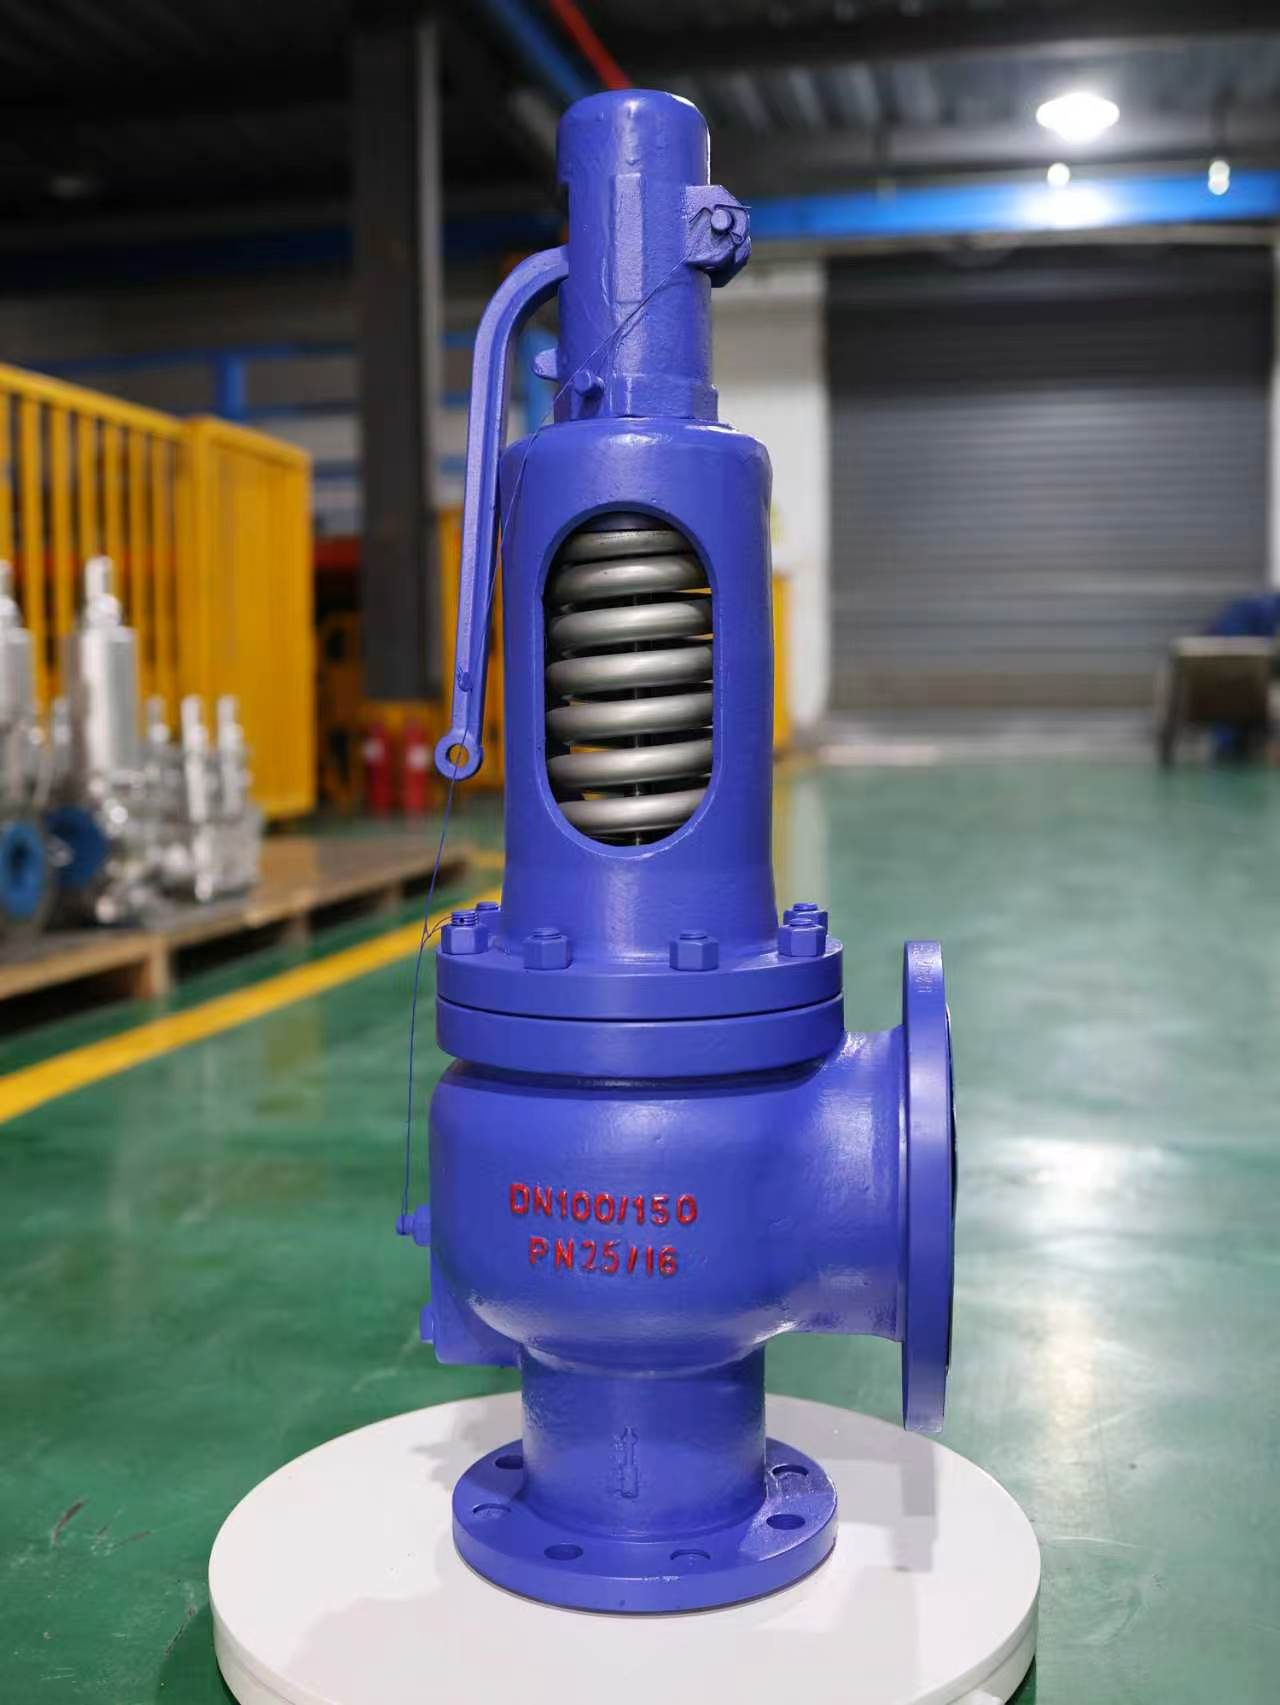
Our own-manufactured flanged, lever-operated, full-lift spring-loaded safety valve (DN100, PN25) of the type installed on boiler drums and superheater outlets.
3. Industry-Specific Steam Usage Patterns
Industry |
Primary Use |
Typical Parameters |
Continuity |
Tire curing |
Curing press saturated steam |
Passenger tires 0.8–1.2 MPa; OTR tires 1.4–1.7 MPa |
24h continuous, ~330 days/year |
Chemical |
Reactor/distillation heating |
Process-dependent, medium-low pressure typical |
Continuous |
Textile/Dyeing |
Setting, dyeing, sizing |
Medium-low pressure |
Continuous, load fluctuates by batch |
Food & Beverage |
Cooking, sterilization |
High dryness fraction required |
Varies by production shift |
Paper |
Dryer cylinder drying |
Medium pressure |
Continuous |
Pharmaceutical |
Sterilization, distillation |
High steam quality required |
Batch |
Steam quality is a critical constraint in specific processes. Tire curing, food sterilization, and pharmaceutical processes require good saturated steam dryness without entrained water — otherwise product quality is directly affected. Safety valve sealing performance and set pressure accuracy are particularly important in these applications — set pressure deviation should be within ±3% (per GB/T 12243-2021).
4. Assessing Your Own Steam Usage Profile: Four Core Questions
Before determining “how to supply steam and what fuel to choose,” answer these questions:
- Continuity: 24-hour continuous use, or intermittent/shift-based? Continuous use suits stable heat supply systems; intermittent use requires attention to start-stop response capability.
- Load fluctuation: What is the difference between peak and off-peak demand? Large fluctuations demand high turndown capability from boilers and fuel systems.
- Pressure level: Does the process require high pressure (e.g., OTR tire curing at 1.4–1.7 MPa) or medium-low pressure? This determines boiler parameters and piping design.
- Condensate recovery rate: Is the condensate after heat release returned to the boiler? Recovery rate directly affects makeup water cost, fuel consumption, and energy metrics.
These four answers essentially define the fuel type and system configuration. The sequence should be: first clarify steam usage characteristics, then discuss fuel selection.
5. Energy-Saving Measures Without Equipment Replacement
Before evaluating major upgrades, consider these low-investment, high-impact measures:
Measure |
Principle |
Reference Effect |
Condensate recovery |
80–100 °C condensate discharged to drain = heat + treated water lost |
Condensate carries 18–25% of total steam heat; each 10% increase in recovery rate saves 1–3% fuel |
Steam trap survey |
Leaking traps lose live steam; waterlogging causes water hammer and reduced heat transfer |
Per the National Board, a 3/8-inch orifice at 100 psi can lose $28,200/year in steam (National Board) |
Pipe insulation repair |
Damaged insulation continuously dissipates heat |
One foot of 1-inch uninsulated pipe at 100 psi loses 326 BTU/hr, equivalent to 30 lbs of fuel over 6,000 hours |
Flue gas heat recovery |
Excessive stack temperature = direct heat loss |
Each 20 °C reduction in stack temperature improves boiler efficiency by ~1% |
Heat exchanger descaling |
1mm scale significantly reduces heat transfer |
Fuel reduction of 5–8% possible after descaling in severe fouling conditions |
Pressure matching |
Low-pressure process supplied with high-pressure steam |
A NREL study showed lowering boiler pressure from 900 kPa to 600 kPa saved 4.7% fuel and reduced distribution condensation losses by 13.3% |
The common thread: no boiler replacement, no fuel change, no process modification — just recovering heat that is already being lost. Once these measures are in place, the cost baseline for fuel evaluation becomes more accurate.
Steam Trap Losses: Hard Data for International Readers
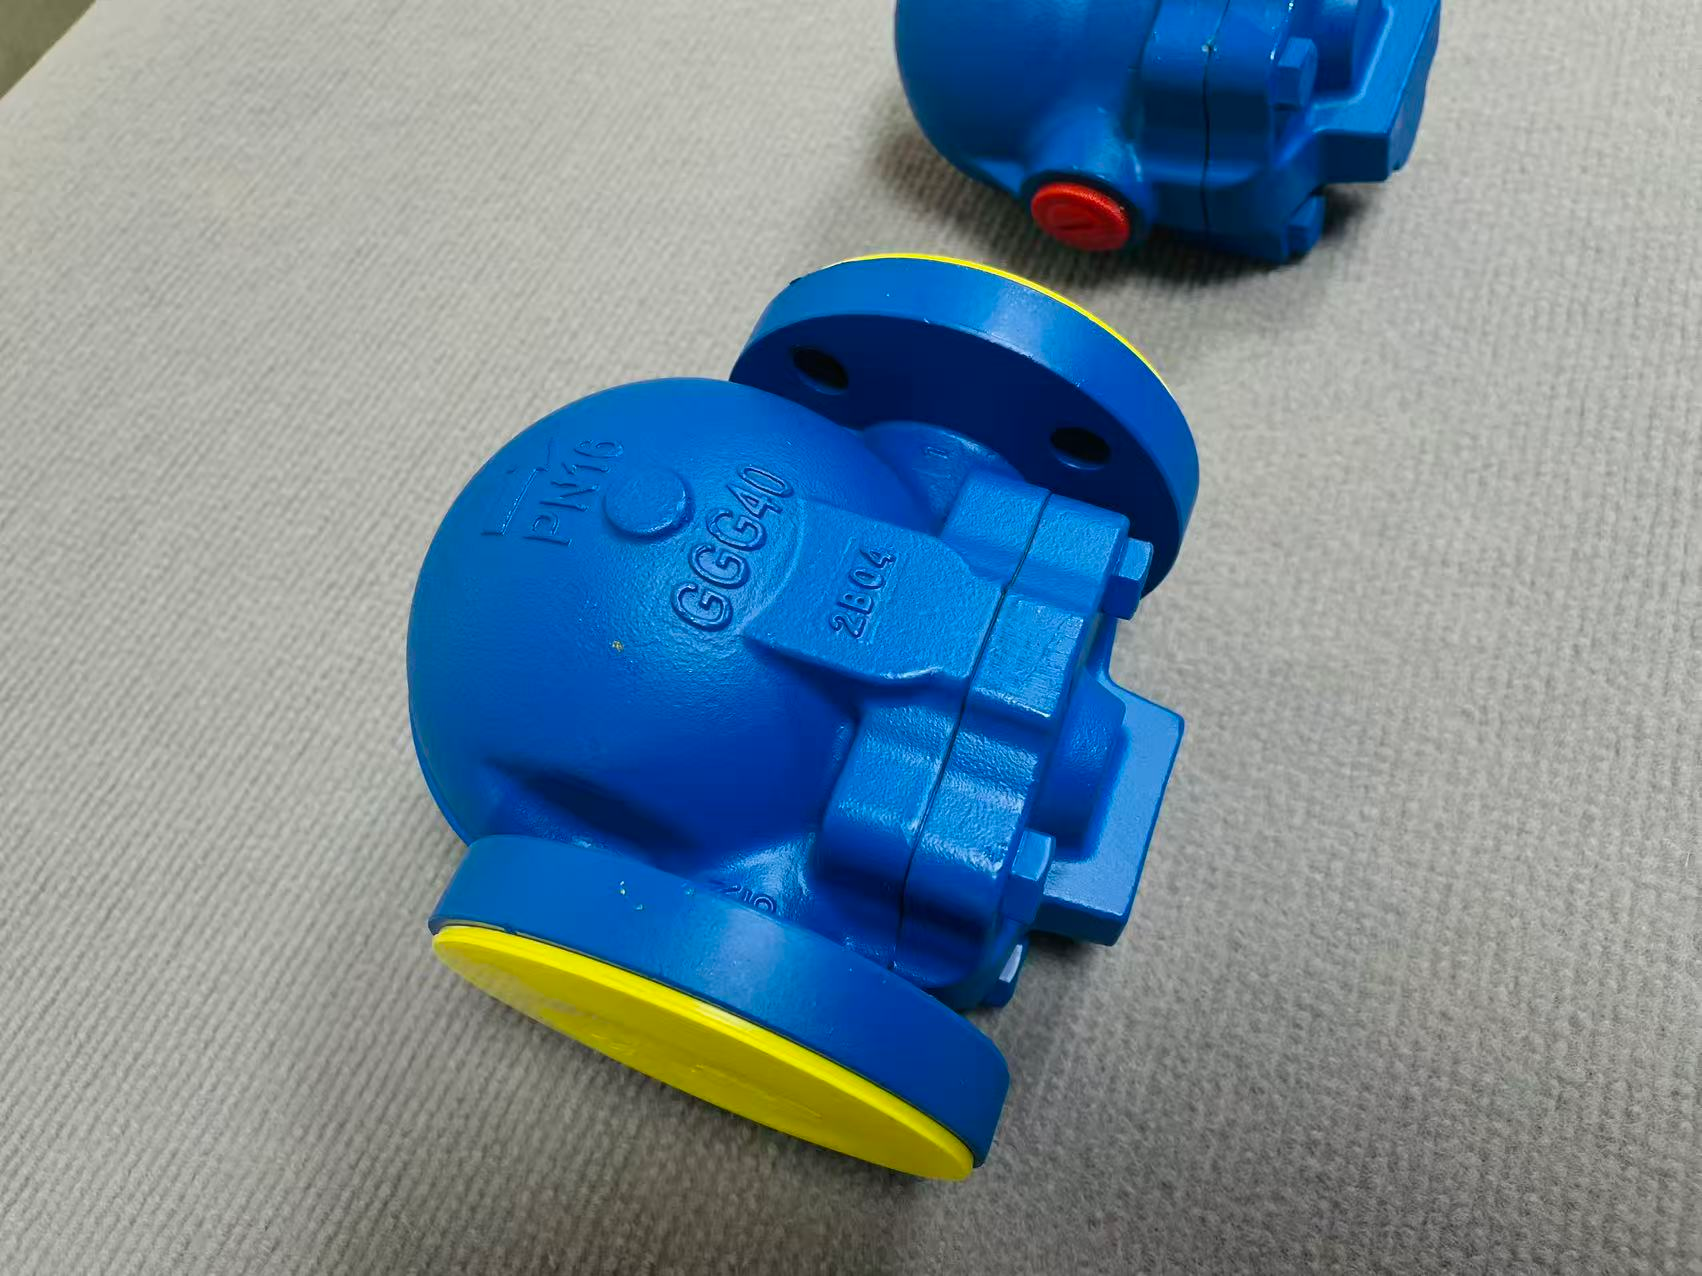
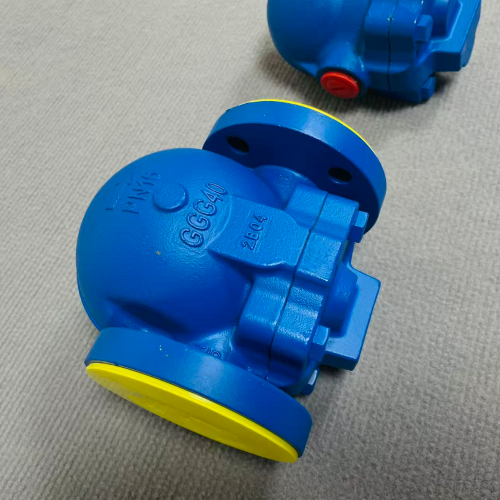
Our own-manufactured flanged ball-float steam trap (PN16, GGG40 ductile iron). It discharges condensate and air while keeping live steam inside — a failed trap either leaks steam to atmosphere or blocks condensate, causing water hammer.
Steam trap failures are one of the most quantifiable and often overlooked sources of waste. According to the U.S. Department of Energy, even well-maintained facilities experience 15–20% trap failure rates per year. Traps that have not been maintained for several years can have failure rates as high as 50%.
The National Board of Boiler and Pressure Vessel Inspectors provides loss estimates for various orifice sizes at 100 psi:
Orifice Size (in.) |
Steam Lost (lbs/month) |
Annual Cost (at $5/1,000 lbs) |
1/2 |
835,000 |
$50,100 |
3/8 |
470,000 |
$28,200 |
1/4 |
210,000 |
$12,600 |
1/8 |
52,500 |
$3,150 |
A documented case study from Northwell Health (New York’s largest healthcare provider) demonstrated the real-world impact: 9,817 steam traps surveyed, resulting in $2,403,672 in gas and electric savings, 946,500 therms saved, and $1,162,551 in utility incentives secured — with an ROI of 1.4 years.
About Steam Safety Valves
Safe steam system operation depends on reliable safety valve performance. Steam safety valves protect boilers, pressure vessels, and piping by automatically discharging overpressure when the set point is exceeded, then closing when pressure recovers. Full-lift spring-loaded safety valves are standard for steam boilers (see Figure 1).
Key performance requirements:
- Set pressure deviation should be within ±3% of the set value
- Seal tightness test: 3 minutes at 90% of set pressure with no leakage
- Annual verification at minimum; re-verification required after disassembly or parts replacement
- Seat leakage accounts for over 70% of safety valve failures — primarily caused by debris, high-velocity steam erosion, and weld overlay cracking
Regular verification and timely maintenance are essential for both steam system safety and efficiency.
Summary
The journey of one tonne of steam is fundamentally a chain: fuel heat → boiler → piping → process → product. Every stage involves heat loss, and every stage offers optimization potential. The prerequisite is clear: first identify which path your steam takes, where it stops in the process, and where the largest losses occur.
The parameters and savings figures in this article are industry-typical reference values. Actual project results depend on specific process requirements and measured data.
Which path does your plant’s steam primarily take? Comments and discussion welcome.
Table of Contents
- 1. How One Tonne of Steam Is Generated
- 2. The Five Paths Steam Takes in a Factory
- 3. Industry-Specific Steam Usage Patterns
- 4. Assessing Your Own Steam Usage Profile: Four Core Questions
- 5. Energy-Saving Measures Without Equipment Replacement
- Steam Trap Losses: Hard Data for International Readers
- About Steam Safety Valves
- Summary